Gradients along planned routes
Figuring out how hard biking to work would be
Around 2020, I was pretty sure that I would like to buy a bike. However, I was absolutely not sure about what kind of bike to buy. A lot depended on my use case – in particular, whether I would use it daily to get to work. As I live in Zurich, which is quite hilly, I was not 100% sure if my commute would be feasible without arriving in the mornings drenched in sweat. Google maps shows an overview of the elevation changes along planned routes, but unfortunately, does not give more precise data, such as actual gradients.
When faced with such a situation, normal people usually borrow a bike from someone, and test drive their commute. I, on the other hand, felt like this is also a problem that can be solved with Python. So it was perfectly clear what I had to do:
- Calculate a route using the Google Maps API.
- Look up the altitude of many equally spaced points along that root, again, using some Maps API.
- Calculate gradients by numerically differentiating this altitude function, possibly applying some kind of smoothing along the way.
Even though I was pretty sure that I (or no one else) would use it ever again, of course it had to be flexible (able to plan various routes for various modes of transport), and easy to use. In the end, I ended up wrapping the API calls and calculations in a web app, served via bokeh server, running on a free Heroku instance. After serving a total of one user, the site is not online anymore, but you can take a look at the github repo for the project, and also run it locally, if you want.
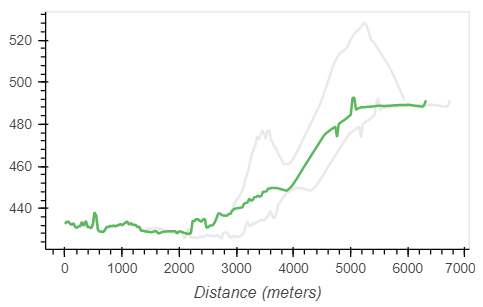
After planning a route, it will create these three helpful graphs, giving you information about elevation changes along your route:


The complete UI is nothing fancy, but of course still overkill for the intended purpose. It looks like this:

In the end, I ended up getting a bike suitable for the commute, but then it turned out that I am really good at finding excuses to take the public transport anyways.